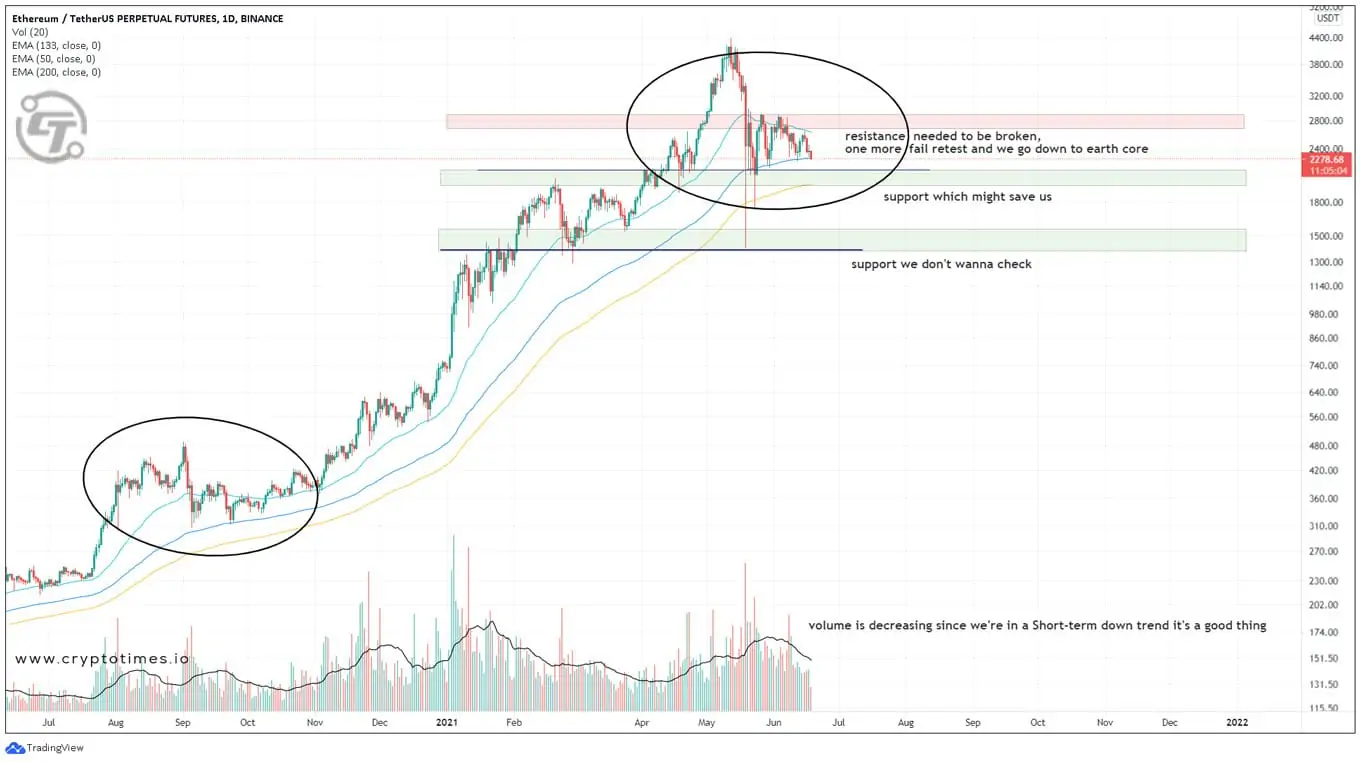
Following the recent dump on the crypto market. Ethereum has taken a massive hit by dropping from $4300 to $1800. Presently it is trading at $2300. Since the beginning of the year, Ethereum has been in the bull trend, making consecutive new All-Time Highs.
Most of us are still in disbelief that it happened the way it did but we’re glad that the dump is over, or is it not?
Well, we can’t say, but we can pay attention to the present situation and try to make an assumption for sure.
Let’s look at the chart and review some technical analysis.
As per the daily chart. Ethereum seems to be a short-term bearish trend. Potentially it could go down as much as $2050.

Key Points
- We’re having a Strong resistance zone at $2680-2980. Breaking it would be most bullish which should take us to $3500.
- We’re above a major support zone at $1850-2140. Going below $1950 would be very bearish. It can take us down to $1400.
- As we look at the chart we sense that the momentum is slowing down. We have pumped super hard from $2000 to $4000 in a matter of 20 days. Following a 50% correction in less than 10 days. Since the dump slowly and steadily we’re reducing the daily movement on either side. We are not pumping much neither are we dumping much. We’ve established a range between $2200-2700.
- Ether trading in a range is bullish long term. it boosts confidence in new investors to buy. also motivates present investors to hold onto their bags.
Bullish Scenario
- As you can see we’re above 133 days EMA. We have been range-bound between 50-133 daily EMA. If we hold 133D EMA as support for a week it’s bullish.
- Our chances to bounce up to $3000 are very high. Historically, this has been bullish as mentioned on the chart.
- Fundamentally, EIP-1559 is scheduled to go live in less than a month in July. Which is the most bullish catalyst for Ethereum, making Ether a deflationary asset.
- Fundamentally, Vitalik has confirmed to expect Ethereum POS to merge by Q1-2022. considering the debate about using clean energy Elon musk and bitcoiners. Ethereum wins hands as it uses way less energy than bitcoin.
- The daily volume is in a downtrend since the dump happened, which indicates we might not go much down.
Bearish Scenario
- Bitcoin looks bearish. Historically, Ethereum follows bitcoin in terms of price action, if bitcoin goes down, Ethereum will follow.
- We’ve lost bullish momentum, by breaking $1950 Ethereum can start a long-term bear trend.
- As overall sentiment is bearish, market buyers are waiting to buy since the direction is uncertain. Everyone wants to buy the bottom.
- We’re at the edge of breaking 133D moving average, breaking it would be bearish.
Suggested Actions
- If you own Ethereum = Hold for a long term
- buy = buy at the market price or DCA (dollar cost average)
- sell = sell if you have leveraged position otherwise Hold


